

Read income statement, balance sheet, and cash flow with a simple, proven system to spot real strength, hidden risk, and true value fast.
Why financial statements feel harder now
Financial statements look familiar, yet the game around them is changing fast. In late 2025, most investors are drowning in data. Earnings decks are polished. Non GAAP metrics are loud. Social feeds push hot takes. Meanwhile, filings are becoming more structured and machine readable, which changes how analysis happens. The result is confusing. People feel behind, even when they are smart.
However, this is also a powerful opportunity. When noise rises, clear basics become a rare advantage. If you can read the three core statements with calm confidence, you can quickly filter hype, compare companies, and spot fragile stories before they break. That skill is still one of the most rewarding in investing.
This guide is built to feel simple, but it is not shallow. You will learn a reliable, repeatable way to read a company’s financials, connect the statements, and judge the quality of earnings. You will also learn what is emerging next, including structured data, new reporting standards, and AI assisted research, so you can stay ahead.
The three statement map you will use every time
A company’s financials are one story told from three angles.
The income statement is performance over time. It answers, “Did this business create profit, and how?”
The balance sheet is position at a point in time. It answers, “Is the business stable, and what does it own versus owe?”
The cash flow statement is movement of cash over time. It answers, “Did the profit turn into cash, and where did cash go?”
Moreover, these statements are linked. If you read them as one system, you stop guessing. If you read them in isolation, you can get trapped by pretty earnings or scary headlines.
Here is the simple order that keeps you grounded:
First, read the income statement to understand the engine. Next, read the cash flow statement to test the engine. Then, read the balance sheet to see whether the engine sits on solid ground. After that, connect them.
This order is practical because profit is easy to manipulate, cash is harder to fake, and the balance sheet reveals hidden stress.
The five minute “business reality” scan
Before you touch numbers, do one quick reality check. What does the company sell? How does it get paid? What are the biggest costs? What is the cash cycle? If the model is unclear, the numbers will feel like a blur.
Additionally, look for two context clues inside the filing. The “MD&A” section is management’s narrative. The risk factors show what could break. This is not for drama. It is for clarity.
[YouTube Video]: A practical walkthrough that shows how the three statements connect and how to read them in a clean order.
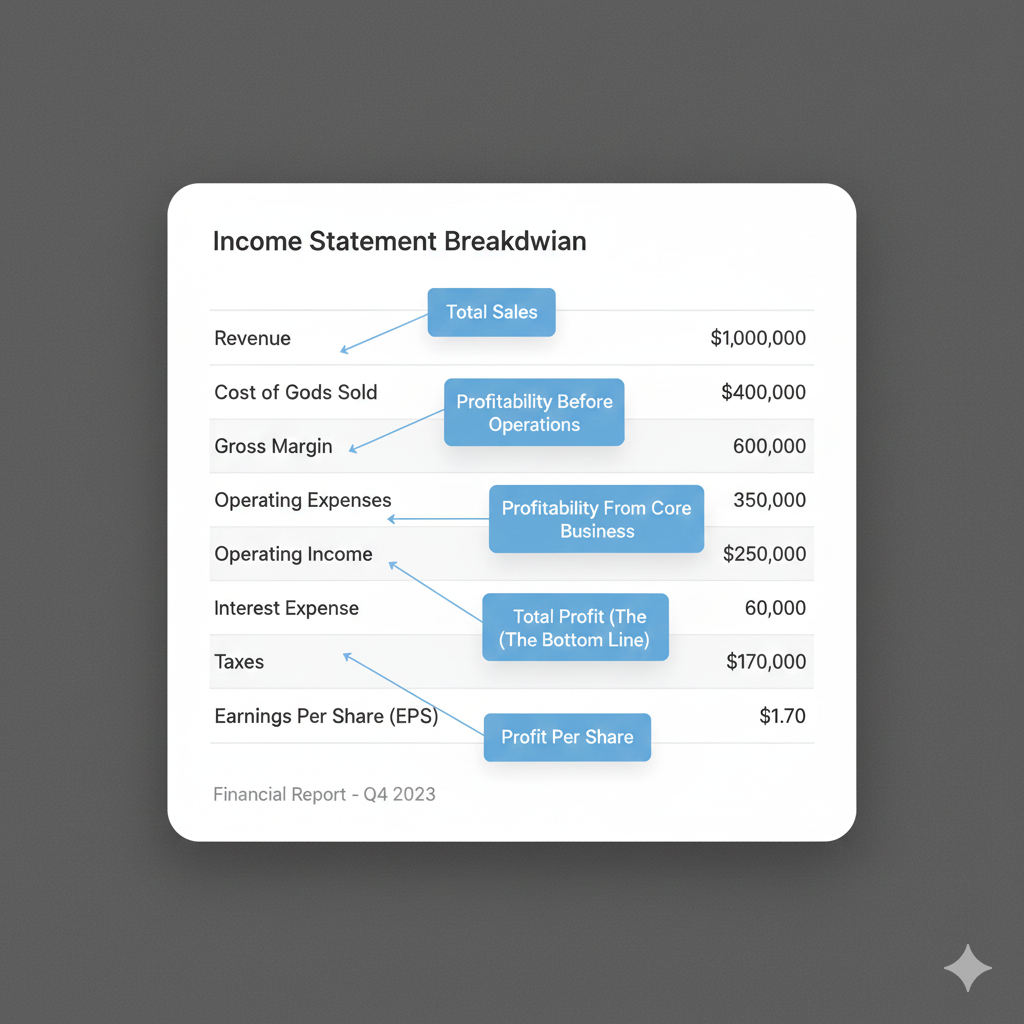
Step 1: Read the income statement for the real engine
The income statement can feel exciting because it shows growth, margins, and earnings per share. It is also the statement most likely to distract you, because presentation choices can flatter results.
Still, it is essential. Start here. Just stay disciplined.
Revenue: growth, mix, and pricing power
Revenue answers one question: is demand real? In 2026, investors are more skeptical of “growth at any cost.” Strong growth still matters, but the quality of that growth matters more.
Look for three signals.
First, consistency. A one time spike can be fragile. Second, mix. Growth from a higher margin segment is more powerful than growth from low margin add ons. Third, pricing power. When a company raises prices and keeps customers, that is a rare, durable advantage.
However, revenue can be inflated by timing tricks, aggressive estimates, or channel stuffing. This is why you will later test it against cash and receivables.
Gross profit: the first truth test
Gross margin is the most underrated signal for business quality. It captures how much value the company keeps after direct costs. A rising gross margin often signals better pricing, better product mix, or stronger cost control. A falling margin can signal competition, commoditization, or input inflation.
Moreover, compare gross margin against peers in the same industry. A company can look “good” alone, but weak in context.
If revenue grows while gross margin collapses, your “growth” may be bought with discounts. That is not a thrilling story. It is a warning story.
Operating expenses: what the company must spend to stay alive
Operating expenses show the company’s strategy and discipline. In plain terms, this is the spending that keeps the machine running and pushes it forward.
Pay attention to R&D, sales and marketing, and general administration. A high R&D line can be a smart investment in future products. A high marketing line can be either an aggressive growth play or a desperate fight to replace churn.
Additionally, watch operating leverage. If revenue grows but operating expenses grow faster, the company may not scale well. If revenue grows and expenses rise slowly, the business model is becoming more efficient and powerful.
Operating income vs net income: where profits get noisy
Operating income is closer to the business core. Net income includes interest, taxes, and other items that can swing.
Be curious about large “other income” lines. Be cautious when net income looks great mainly because of non operating gains, one time settlements, or accounting revaluations.
Furthermore, note how management highlights non GAAP measures. Non GAAP can be useful when it removes truly unusual items. Non GAAP becomes dangerous when it repeatedly removes normal costs, like recurring stock based compensation, restructuring every year, or ongoing legal expenses in a business where lawsuits are normal.
EPS: the headline that can hide dilution
Earnings per share is what many people trade on. Yet EPS can rise even if business quality falls, especially if buybacks shrink the share count. Buybacks can be smart. They can also be a mask if debt rises to fund them.
Additionally, watch dilution. If share count keeps rising due to stock compensation, your ownership may shrink even when profit rises. That can quietly drain long term returns.
Step 2: Read the cash flow statement as the truth serum
If the income statement is the pitch, the cash flow statement is the reality check. It is not perfect either, but it is harder to manipulate for long periods.
Moreover, in a world of AI summaries and fast takes, cash flow remains a reliable anchor. It tells you whether the company actually generated spendable cash, not just accounting profit.
Start with cash from operations: does profit convert to cash?
Cash flow from operations should generally track net income over time for a healthy, mature business. Differences are normal. Huge, persistent differences are important.
A classic red flag is “earnings up, cash down” for many quarters. This can happen for valid reasons, such as rapid growth that increases receivables and inventory. Still, it can also signal aggressive revenue recognition or weak collections.
Additionally, read the adjustments section. Depreciation, amortization, and stock based compensation are common add backs. These add backs increase operating cash flow, but they are not free money. Depreciation represents wear on assets. Stock compensation represents real dilution over time. Treat these as signals, not gifts.
Investing cash flow: what the company builds or buys
Investing cash flow is where you see capital spending, acquisitions, and asset sales. A company that invests heavily can be setting up a breakthrough future. A company that under invests can look profitable today but fragile tomorrow.
However, you must judge investment quality. Capex that supports strong returns is powerful. Capex that keeps expanding capacity in a weak demand environment is risky.
Moreover, acquisitions deserve extra skepticism. Many acquisitions look exciting at announcement and disappointing in hindsight. Watch for repeated acquisitions that keep “creating adjusted earnings” while real cash stays thin.
Financing cash flow: how the company funds itself
Financing shows debt issuance, debt repayment, dividends, and buybacks.
A healthy pattern often looks like this: operating cash flow funds reinvestment, and excess cash funds buybacks or dividends. A riskier pattern looks like this: debt funds buybacks, while operating cash flow struggles.
Additionally, interest payments matter more in a higher rate world. In 2026, the market remains sensitive to leverage and refinancing risk. Debt maturity schedules can quietly become a critical issue.
Step 3: Read the balance sheet for resilience and hidden stress
The balance sheet is where you see what the company owns, what it owes, and what is left for shareholders. It is also where accounting choices can hide problems in plain sight.
However, you do not need to be an accountant to get value. Focus on structure, trend, and red flags.
Cash and short term investments: the shock absorber
Cash is a company’s ability to survive surprises. A strong cash position can protect against recessions, supply shocks, lawsuits, or sudden demand drops. It also enables opportunity, like buying competitors cheap during a downturn.
Additionally, compare cash to total debt. Net cash businesses have more flexibility. Net debt businesses can still be great, but they rely on steady cash generation.
Receivables: the early warning system
Receivables show money the company is owed. When receivables grow faster than revenue, it can signal weaker collections or looser credit terms to push sales. That can be a subtle but serious warning.
Moreover, if a company reports strong revenue but receivables explode, you should later check operating cash flow. The story must fit.
Inventory: the silent risk
Inventory is tricky because it depends on the business model. Retail, manufacturing, and hardware naturally hold inventory. Software often does not.
Still, inventory growth faster than sales can signal demand weakness or poor forecasting. Write downs can hit margins later. That is why inventory is a classic red flag in cyclical industries.
Debt and liabilities: the pressure points
Look at total debt, then scan current liabilities. Current liabilities are obligations due within a year. If current liabilities rise sharply without clear reason, liquidity stress may be building.
Additionally, pay attention to lease liabilities. Many businesses have long term lease obligations that function like debt. This matters when consumer demand drops or locations underperform.
Equity: what shareholders truly own
Equity is assets minus liabilities. It is not “market value.” Still, it tells you how the company finances itself.
If equity shrinks because of losses, dilution, or aggressive buybacks funded by debt, risk can rise even if EPS looks strong.
Moreover, look for accumulated deficits, negative equity, or rapidly changing equity lines. These can be signs of financial strain or complex capital structures.
[YouTube Video]: A clear, CFO style explanation of how to read a balance sheet and spot stability versus danger.
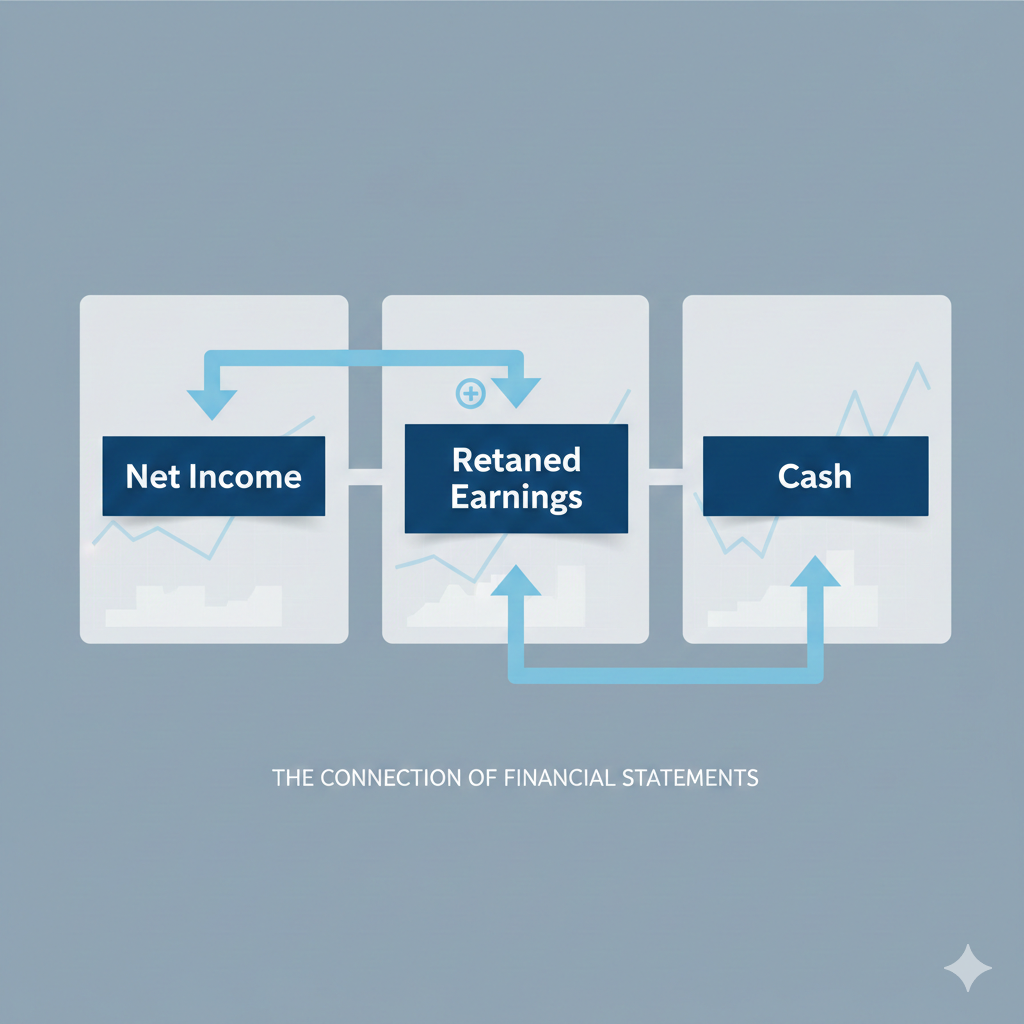
Connect the statements: three bridges that unlock clarity
This is where you become fast and confident. Connecting statements turns scattered numbers into one coherent narrative.
Bridge 1: Net income flows into equity
Net income increases retained earnings, which sits in equity. Losses reduce it. Dividends reduce it. Buybacks can reduce equity too.
If net income is strong but equity does not build over time, something else is draining value, like buybacks, dividends, write downs, or dilution effects.
Bridge 2: Depreciation and capex explain the gap between profit and cash
Depreciation reduces accounting profit, but it is not a cash expense today. Capex is a cash expense today, but it is not fully expensed in profit today.
Therefore, two companies can report the same net income and have totally different cash flow, depending on capex needs.
A capital light business often converts profit to cash more easily. A capital heavy business can still be great, but it must earn strong returns on invested capital.
Bridge 3: Working capital links sales to cash timing
Working capital is the timing engine of cash. Receivables, inventory, and payables change how quickly sales become cash.
If receivables rise, cash can fall even as profit rises. If inventory rises, cash can fall. If payables rise, cash can temporarily rise, but that can be a short term boost.
Moreover, working capital swings are where many surprises hide. You do not need complex math. You need trend awareness and business logic.
A practical, repeatable reading workflow that fits real life
A common trap is trying to “analyze everything.” That becomes exhausting. Instead, use a tight workflow.
First, read the business overview and the MD&A to understand the story. Next, scan the income statement for growth and margins. Then, go straight to cash flow and see if the story holds. After that, check the balance sheet for resilience.
Finally, write a one paragraph summary in your own words. This sounds simple. It is powerful. If you cannot explain the business and the financial story in one paragraph, you do not understand it yet.
Additionally, build a tiny habit: compare the last three years, not just one year. Trend beats snapshot.
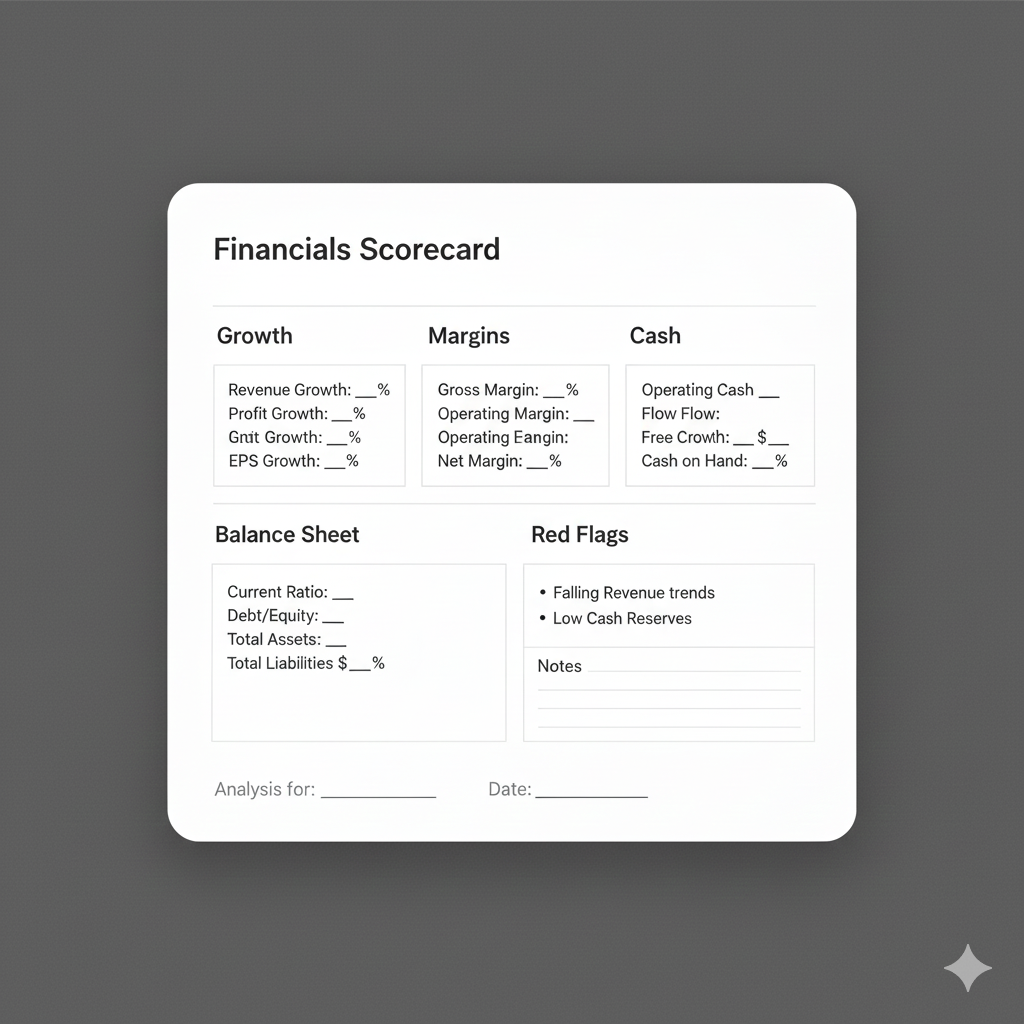
Your “one page scorecard” in plain language
Keep it short. Keep it honest.
Write: revenue trend, margin trend, cash flow trend, debt trend, and any major red flags. Add one line about valuation only after you trust the quality.
If you do this consistently, you gain a sharp edge. You stop being easily influenced by headlines. You become calm, decisive, and reliable in your thinking.
Red flags that matter in 2026 and beyond
The market’s focus shifts over time. In 2026, several red flags are especially important because capital is more expensive and trust is more fragile.
Profit looks great but cash stays weak
This is one of the most critical signals. Sometimes it is fine. Often it is not.
If operating cash flow stays weak for years, ask why. Is it working capital? Is it aggressive revenue recognition? Is it heavy capitalization of costs? This one pattern has exposed many fragile stories.
Receivables grow faster than revenue
This can signal “sales on paper.” It can also signal longer payment terms. Either way, it deserves attention.
Additionally, compare receivables growth with the company’s statements about demand and pricing. If the story is “strong demand,” collections should not suddenly become difficult without a reason.
Inventory builds up before write downs
In consumer products and manufacturing, inventory can become a hidden crisis. Inventory rising with slowing sales can lead to discounting, margin collapse, and write downs.
Moreover, watch gross margin during inventory build ups. If margin looks good while inventory climbs, the pain may be delayed.
Debt rises while buybacks rise
Buybacks are not automatically good. They are good when funded by durable free cash flow and done at reasonable prices. They are risky when funded by debt in a fragile cash flow environment.
Furthermore, look at interest expense trend. Rising interest expense can quietly reduce future earnings power.
Constant “adjustments” that never end
If “one time” costs happen every year, they are not one time. That is a classic credibility issue.
In a future where filings are easier to compare through structured data, repeated adjustments can stand out more quickly. This increases reputational risk.
What is emerging: standards, structured data, and AI research
To stay ahead, you need to understand the direction of reporting.
IFRS 18: a major presentation shift is coming
IFRS 18, issued in 2024, changes how companies present and disclose performance, including new subtotals and more consistent operating categories. It becomes effective for periods beginning on or after January 1, 2027. Early adoption is permitted. This matters because comparability should improve over time, and companies may change how they present performance. (IAS Plus)
Additionally, analysts should expect transition years where numbers look different, even if the business did not change. That is a classic moment for confusion and opportunity.
Sustainability disclosures: more “financial adjacent” data enters the core
The ISSB’s IFRS S1 and IFRS S2 have an effective date of January 1, 2024, and many jurisdictions are building roadmaps for adoption. (IFRS)
This affects financial reading because climate and sustainability risks can influence cost of capital, asset lives, insurance costs, and supply chain resilience. Even if you do not “trade ESG,” the cash impacts can become real.
Meanwhile, the U.S. SEC climate disclosure rule has been in legal and policy flux, including a 2025 SEC vote to end its defense of the rule, with litigation paused while the SEC’s stance is addressed. (SEC)
XBRL and structured filings: comparisons get faster
The SEC continues to publish detailed XBRL guidance for filers, and taxonomy updates keep expanding structured disclosure. (SEC)
For investors, the takeaway is simple. More data will be tagged. Tools will compare filings faster. Sloppy narratives will be easier to detect. This is a breakthrough for disciplined analysis, because you can screen for patterns before reading deeply.
AI copilots: helpful, but only if you keep the steering wheel
AI tools can summarize earnings calls and draft analysis. That is convenient. It can also be dangerously confident.
Therefore, treat AI as an assistant, not a judge. Use it to speed up extraction, then verify with primary statements. Your edge is judgment.
A powerful habit is to ask AI to list uncertainties and contradictions, not just conclusions. Additionally, ask it to show the exact line items that support its claims. If it cannot, you have a red flag.
[YouTube Video]: A clear explainer on cash flow and why it can beat earnings for judging business strength.
🔗 https://www.youtube.com/watch?v=vMBKCSTEqHk
A simple reset plan for investors: from confusion to confident reading
At this point, you have the core skills. Now you need a plan that makes it real.
Start with one company you already know. Read its last annual report. Use the workflow. Write the one paragraph summary. Then repeat with a competitor. The comparison will sharpen your eye quickly.
Next, choose one metric to track for a month. Pick gross margin trend, operating cash flow trend, or net debt trend. Tracking one metric builds intuition without overwhelm.
Moreover, build a “red flag library” in your notes. Every time you see a pattern like receivables outrunning revenue, write it down. Over time, this becomes your personal playbook.
How to prepare for the next wave of reporting
Between now and 2027, you will see more changes in presentation and disclosure. Companies may adopt new subtotals under IFRS 18. Sustainability disclosures may become more common and more comparable. Structured data will expand.
Consequently, the investor who wins is not the one who reads the most. It is the one who reads cleanly, verifies quickly, and stays emotionally calm.
The future rewards disciplined curiosity. It punishes impulsive certainty.
Conclusion: the calm advantage is real
Reading financial statements is not about feeling like a genius. It is about building a reliable process that protects you from narratives and gives you confident clarity.
In a noisy market, the three statement system is a proven anchor. It helps you spot strength, detect risk, and understand value.
Furthermore, as reporting becomes more structured and tools become faster, your process becomes even more powerful. You will spend less time guessing and more time making clear, grounded decisions.
If you want one final goal, make it this: read three sets of financials this week, and write three one paragraph summaries. That small, consistent habit is a surprisingly strong upgrade.
Sources and References
- IFRS 18: Presentation and Disclosure (IAS Plus)
- IFRS S1: Effective date and materials (IFRS)
- SEC: Beginner’s Guide to Financial Statements (SEC)
- SEC: EDGAR XBRL Guide (Nov 2025) (SEC)
- Investor.gov: How to Read a 10-K (investor.gov)
- SEC Press Release: End Defense of Climate Rules (SEC)
- Reuters: Court pauses SEC climate rule challenges (Reuters)
- Investopedia: Financial Statements Overview (Investopedia)
- CFA Institute: Intro to Financial Statement Analysis (CFA Institute)
- FASB Conceptual Framework (Sept 2024 PDF) (storage.fasb.org)